#
High School Students
Undergraduates
Graduate Students
Medical Students
Residents
Fellows
Graduates
Faculty
Analysts
Staff
Collaborators
Other
Personalized Path
Imagine embarking on a journey through an exciting maze. Some paths are straight and easy, while others might be winding and require a bit more thought. With Fena, you have a map and compass to guide you, whether you’re just starting out or are an experienced explorer in the field of clinical research.
Whether you’re a high school student just getting started or a seasoned researcher, Fena offers the resources to navigate the diverse landscape of challenges that come your way. Our tools and community are here to help you turn these challenges into stepping stones towards success.
Our logo, a network of nodes & edges, is a symbol of our interconnectedness. It reflects our shared pursuit of medical progress and the bonds that tie us together in this exciting endeavor.
Join us at Fena, where we are all in this together, turning challenges into opportunities and striving for a brighter, healthier future.
The Balance of Flow
At Fena, we understand that success in clinical research is about finding the right balance. It’s about aligning your skills with the challenges you face, creating a state of optimal performance that psychologists call “flow.”
Below, you’ll find a visual representation of this principle:
Show code cell source
import matplotlib.pyplot as plt
import numpy as np

# Create data for the skill and challenge levels
skill_levels = np.linspace(0, 10, 100)
challenge_levels = np.linspace(0, 10, 100)

# Define the flow channel boundaries
flow_channel = skill_levels

# Adjust the phase and amplitude of the sinusoid wave
phase = np.pi / 16
amplitude = 1.5
sinusoid = flow_channel + np.sin(skill_levels + phase) * amplitude

# Define the yellow zone boundaries, making it wider
yellow_zone_low = skill_levels - 1.5  # Adjust this value to make the yellow zone wider or narrower
yellow_zone_high = skill_levels + 1.5 # Adjust this value to make the yellow zone wider or narrower

# Plotting
plt.figure(figsize=(15, 10))

# Plot the anxiety and boredom areas
plt.fill_between(skill_levels, yellow_zone_high, 10, color='orangered', alpha=0.3, label='Place/Identification', interpolate=True)
plt.fill_between(skill_levels, 0, yellow_zone_low, color='lime', alpha=0.3, label='Time/Revelation', interpolate=True)
plt.fill_between(skill_levels, yellow_zone_low, yellow_zone_high, color='yellow', alpha=0.3, label='Agent/Evolution', interpolate=True)

# Plot the sinusoid function with the diagonal as its axis
plt.plot(skill_levels, sinusoid, color='purple', linestyle='-')

# Add arrowhead to the sinusoid line
plt.arrow(skill_levels[-2], sinusoid[-2], skill_levels[-1] - skill_levels[-2], sinusoid[-1] - sinusoid[-2],
          color='purple', length_includes_head=True, head_width=0.15, head_length=0.3)

# Set plot labels and title
plt.xlabel('Skill-level', fontsize=18)
plt.ylabel('Challenge-level', rotation='vertical', fontsize=18)

# Set plot limits and grid
plt.xlim(0, 10)
plt.ylim(0, 10)
plt.grid(True)

# Set tick labels
tick_labels = ['0', '2', '4', '6', '8', '10']
plt.xticks(np.linspace(0, 10, 6), tick_labels)
plt.yticks(np.linspace(0, 10, 6), tick_labels)

# Add text annotations to label the areas without shaded background
plt.text(1, 6, 'Anxious', color='black', ha='center', va='center', fontsize=18)
plt.text(4.5, 4.7, 'Flow', color='black', ha='center', va='center', fontsize=18)
plt.text(8, 3, 'Bored', color='black', ha='center', va='center', fontsize=18)

# Display the plot
plt.show()
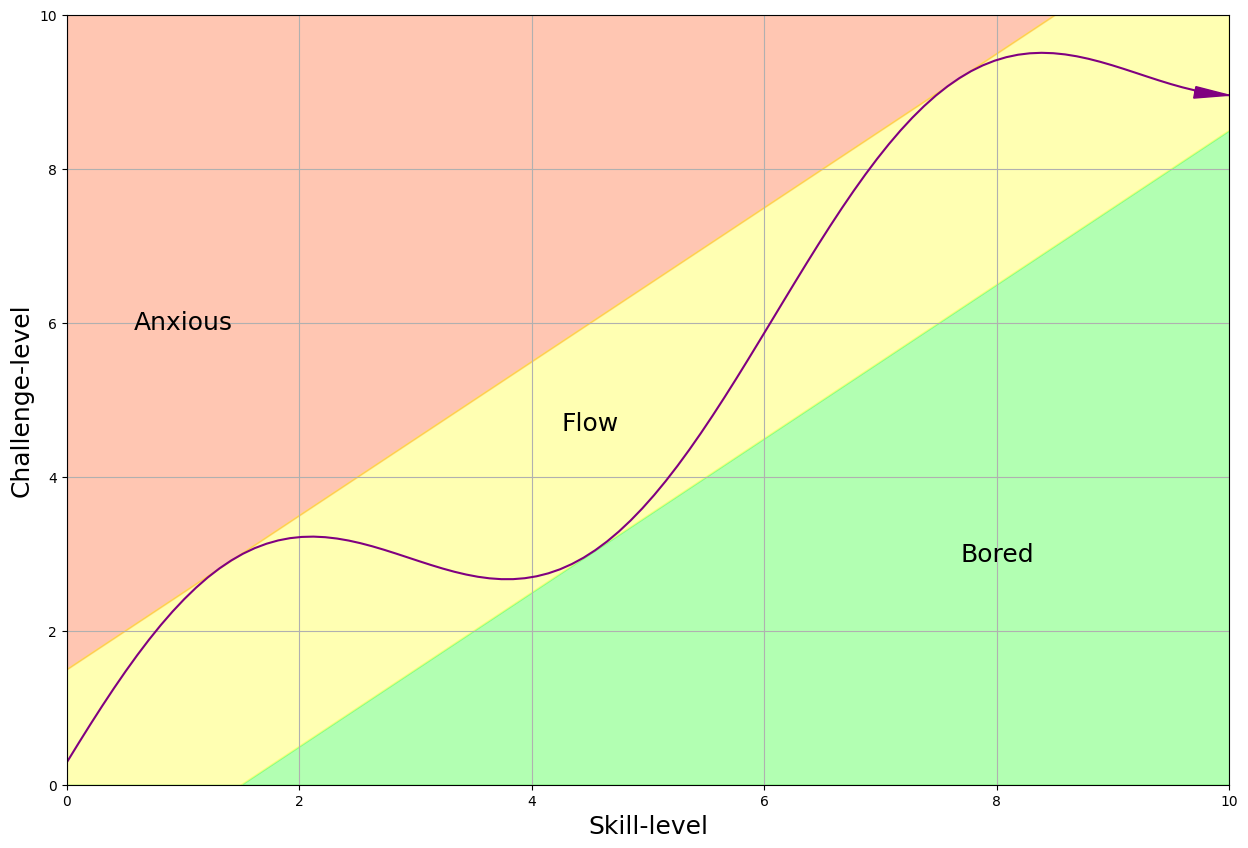
In this plot, the “flow” channel is where skill level and challenge level are in harmony. Stray too far above, and you may feel anxious or overwhelmed. Dip too far below, and boredom sets in. But within that channel, you’re in the zone of maximum productivity and enjoyment.
This platform’s key objective is to facilitate “flow,” a state of optimal performance where challenges are perfectly balanced with skills. By embracing tools such as Python, AI tools (ChatGPT and GitHub Copilot), R, Stata, and more, one should never be overwhelmed by the tasks encountered in clinical research.
We’re here to help you find your flow, guiding you through the complexities and empowering you to excel in your clinical research journey.
Contact us: muzaale@jhmi.edu, zjin26@jhmi.edu.
Enroll in our courses.
Show code cell source
import networkx as nx
import matplotlib.pyplot as plt

# Set seed for layout
seed = 1234567890

# Directory structure
structure = {
    "Challenges": ["Fraud", "Sloppiness", "Rigor", "Learning", "Truth", "Error"],
    "Literacy": ["Grants", "Self-publish", "Knowledge-Gaps", "Open-Science", "Journals"],
    "Numeracy": ["Stata", "Estimates", "R", "AI", "Python"],
    "Project": ["Manuscripts", "Git", "Code"],
    "Skills": ["Literacy", "Project", "Numeracy", "Workflow", "Challenges"],
    "Workflow": ["High School Students", "Undergraduates", "Graduate Students", "Medical Students", "Residents", "Fellows", "Faculty", "Analysts", "Staff", "Collaborators", "Graduates"],
}

# Gentle colors for children
child_colors = ["lightgreen", "lightpink", "lightyellow", 'white', 'honeydew', 'lightcoral','azure', 'lightblue','lavender']

# List of nodes to color light blue
light_blue_nodes = ["Literacy", "Numeracy", "You", "Project", "Challenges"]

G = nx.Graph()
node_colors = {}

# Function to capitalize the first letter of each word
def capitalize_name(name):
    return ' '.join(word.capitalize() for word in name.split(" "))

# Assign colors to nodes
for i, (parent, children) in enumerate(structure.items()):
    parent_name = capitalize_name(parent.replace("_", " "))
    G.add_node(parent_name)

    # Set the color for Skills
    if parent_name == "Skills":
        node_colors[parent_name] = 'lightgray'
    else:
        node_colors[parent_name] = child_colors[i % len(child_colors)]

    for child in children:
        child_name = capitalize_name(child.replace("_", " "))
        # Exclude "Co-Pilot" and "ChatGPT"
        if child_name not in ["Co-Pilot", "ChatGPT"]:
            G.add_edge(parent_name, child_name)
            if child_name in light_blue_nodes:
                node_colors[child_name] = 'lightblue'
            else:
                node_colors[child_name] = child_colors[(i + 8) % len(child_colors)]  # You can customize the logic here to assign colors

colors = [node_colors[node] for node in G.nodes()]

# Set figure size
plt.figure(figsize=(30, 30))

# Draw the graph
pos = nx.spring_layout(G, scale=30, seed=seed)
nx.draw_networkx_nodes(G, pos, node_size=10000, node_color=colors, edgecolors='black')  # Boundary color set here
nx.draw_networkx_edges(G, pos)
nx.draw_networkx_labels(G, pos, font_size=20)
plt.show()
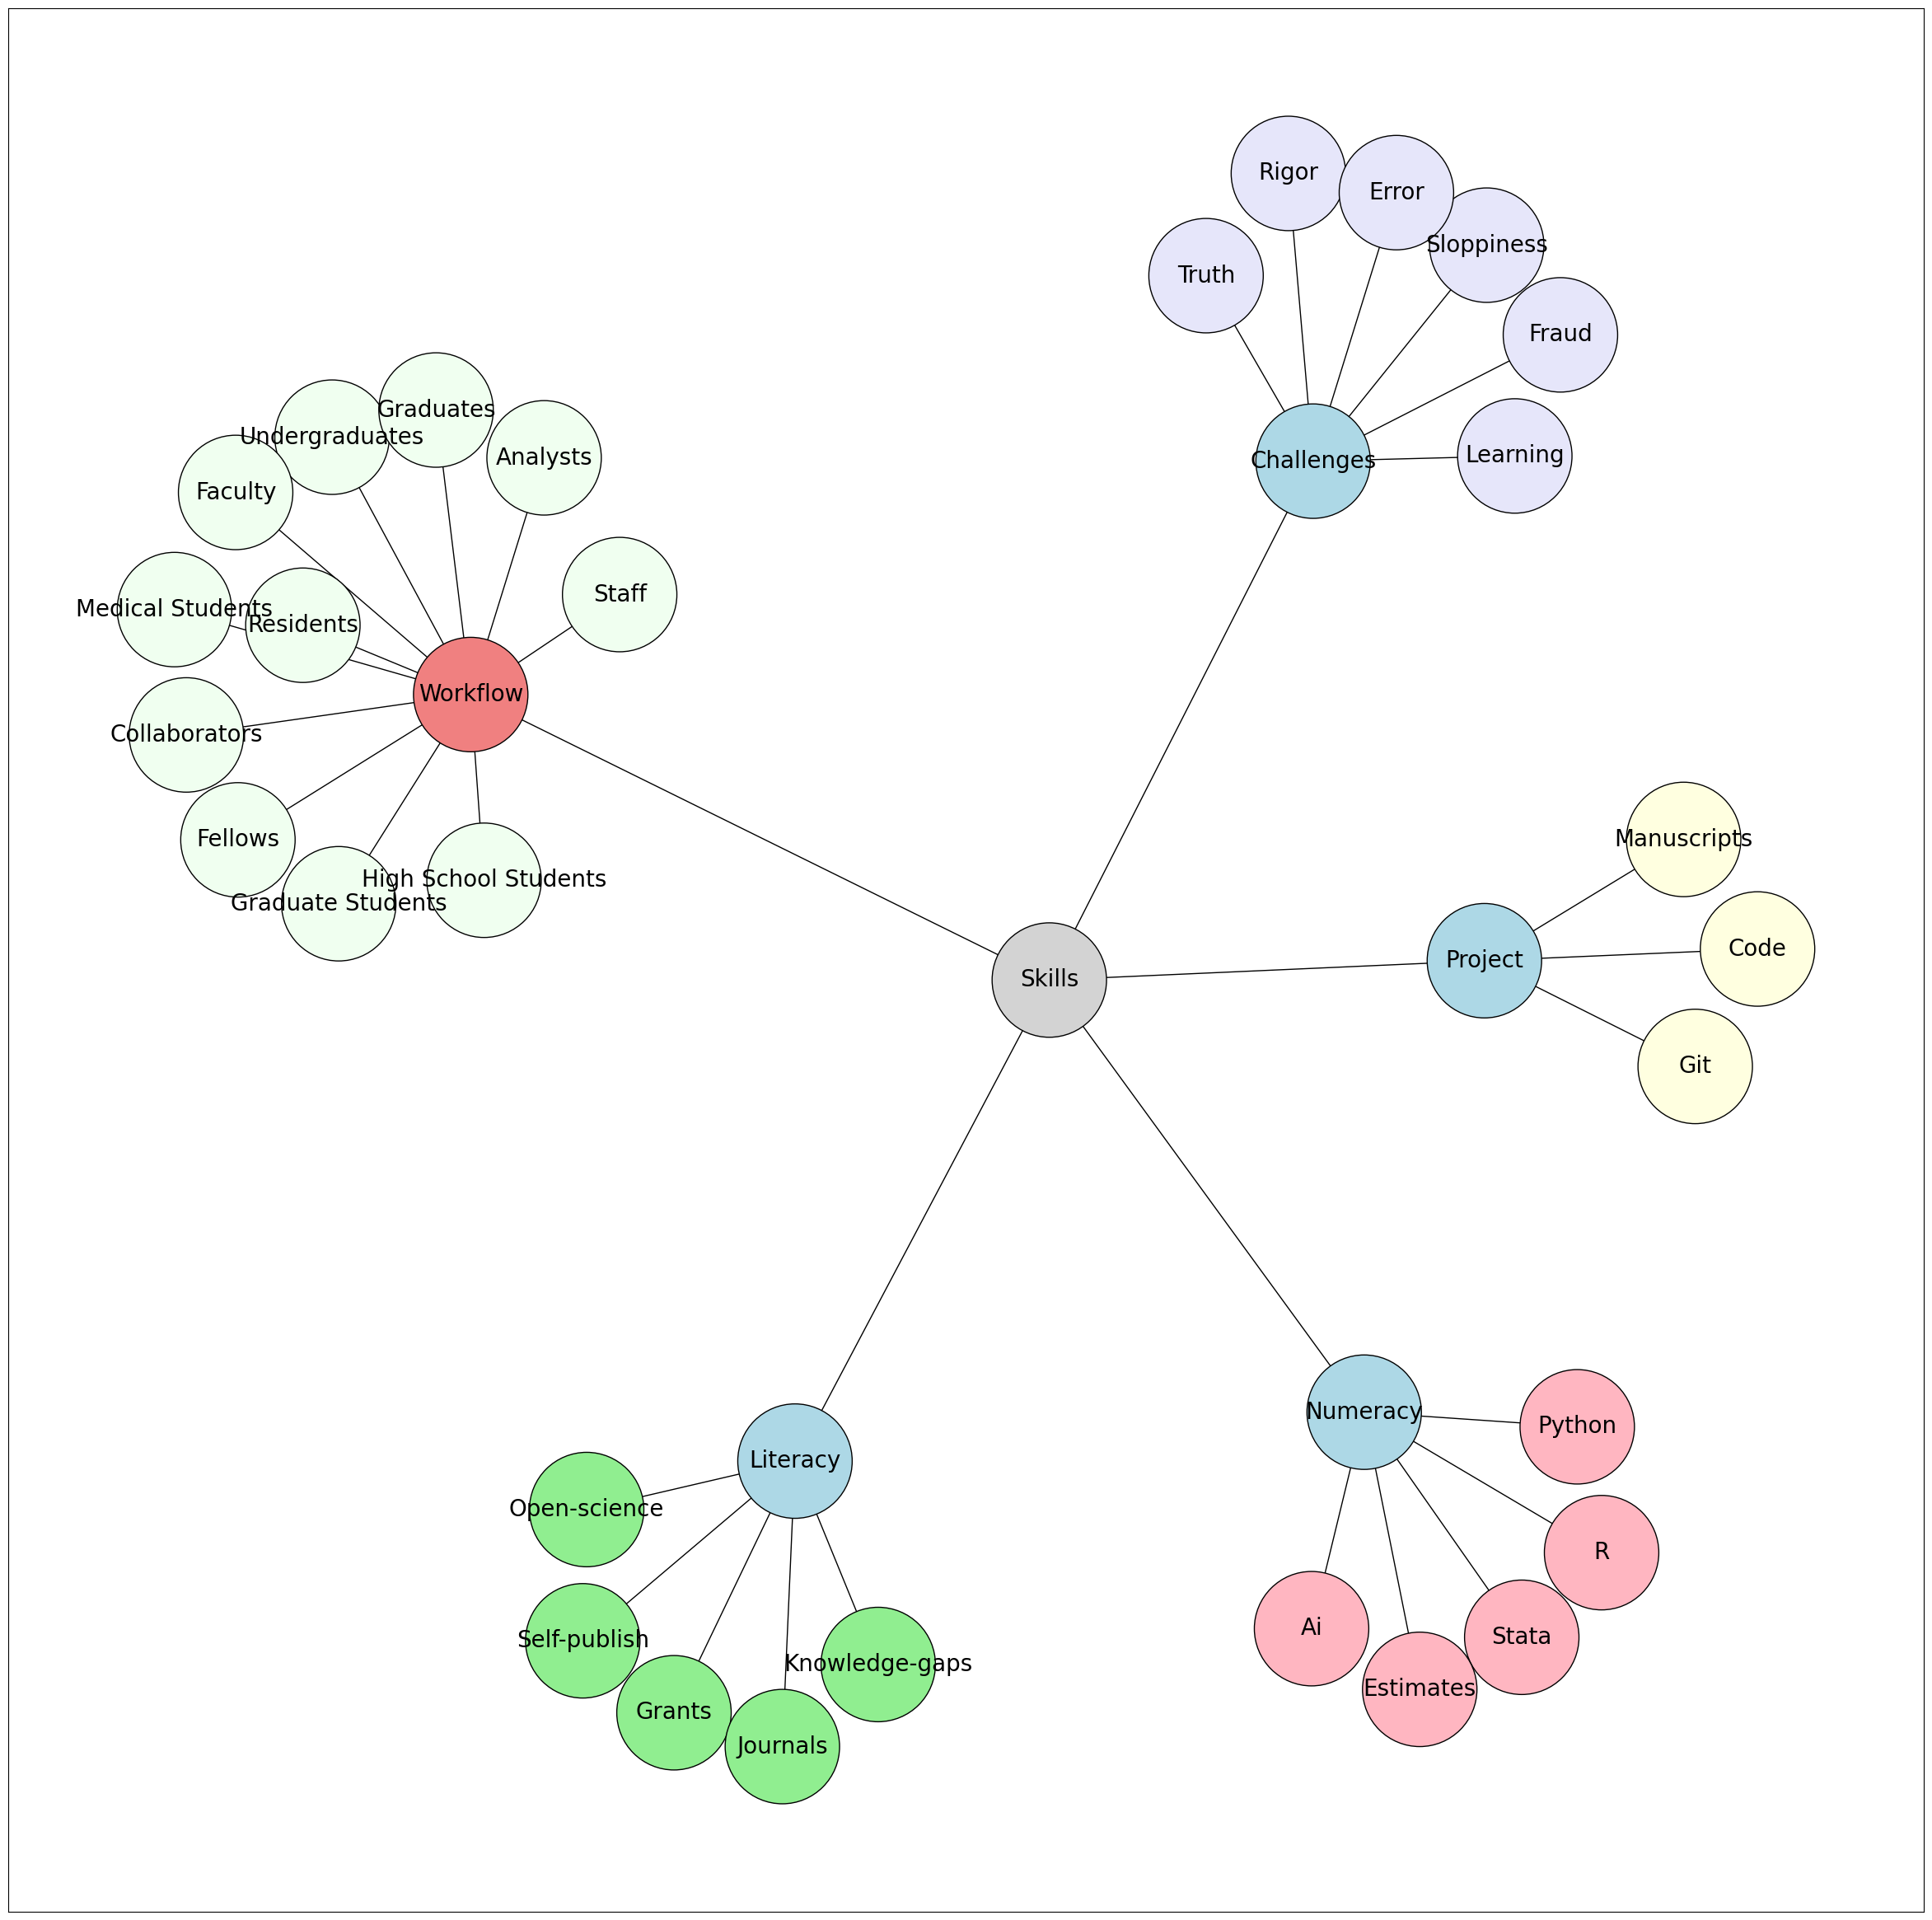
Skills:
Challenges - Humanity
Project - Management
Numeracy - Statistics
Literacy - Writing
Workflow - Tradition